This article highlights some of the basic features of arivis VisionHub.
Introduction
arivis VisionHub is a web-based platform for image storage and analysis, allowing easy shared access to datasets for multiple collaborators without the need to transfer huge amounts of data. VisionHub offers full traceability of changes to datasets and permission access to limit who can view or edit images. It is based on arivis ImageCore to enable the processing of datasets of virtually any size.
In this article, we take a look at the landing page and basic navigation.
The Landing Page
After logging into VisionHub, users are presented with the landing page below. Note that some options may be unavailable if the user doesn't have admin privileges.
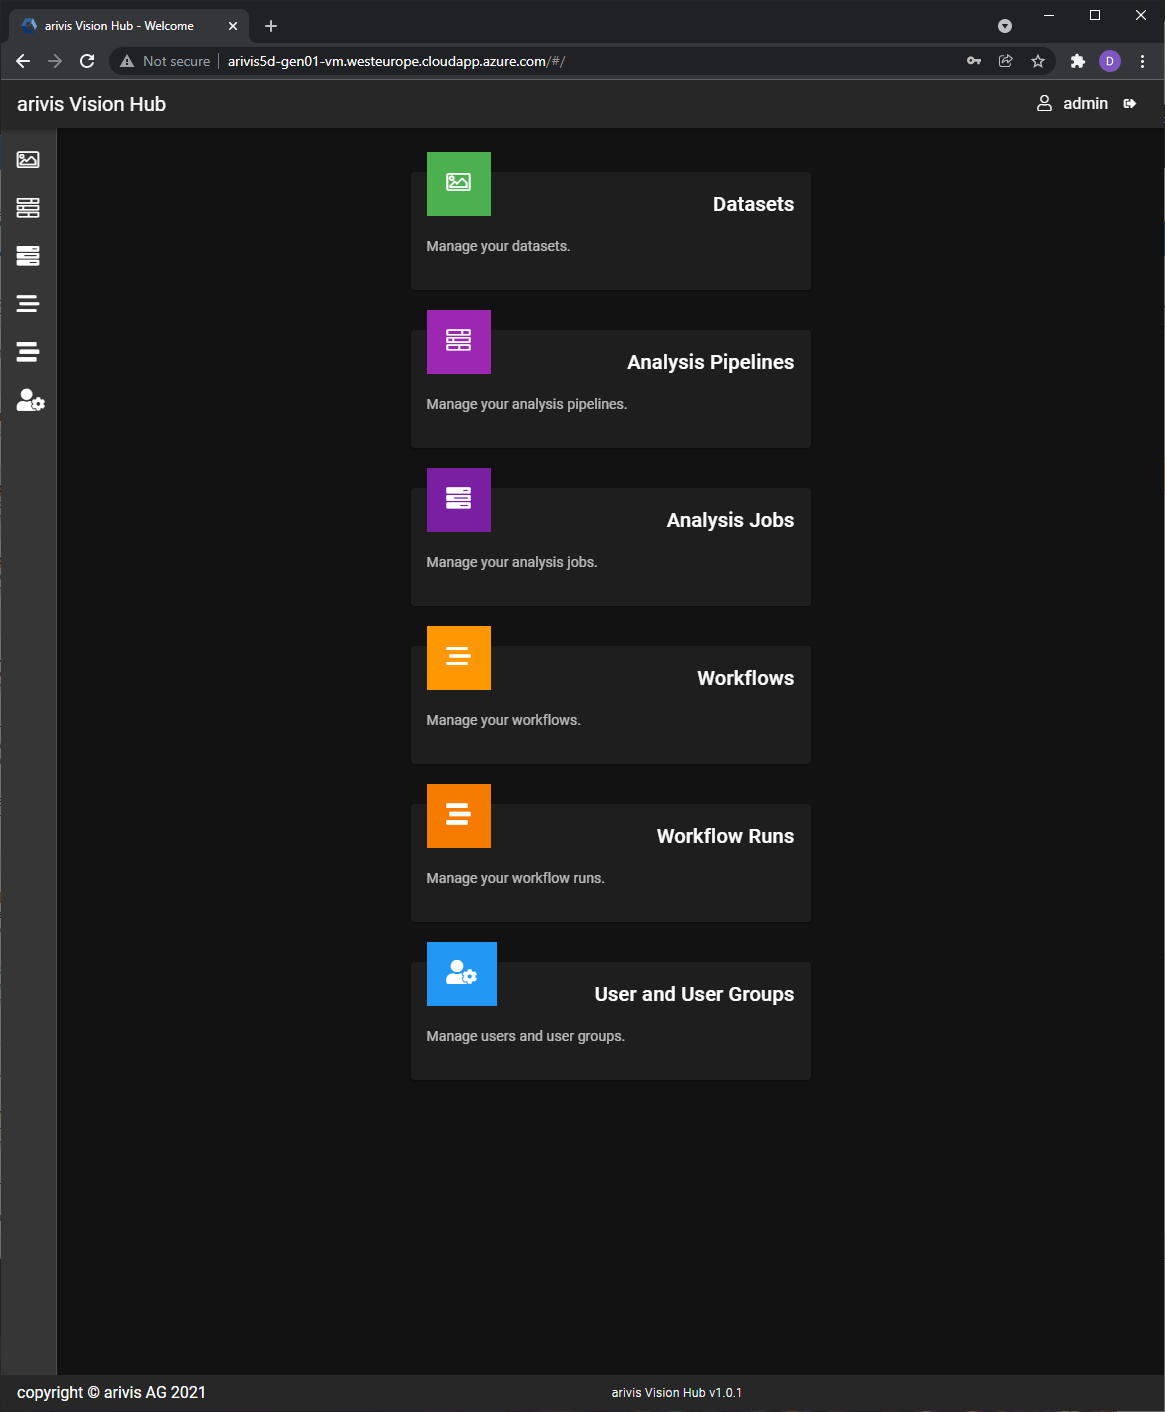
Users can return to the landing page by clicking on the arivis VisionHub text in the top left of the page at any time.
The landing page gives direct access to most of the functionality of the Hub, including:
- Datasets - Allows the user to navigate to any dataset they have been granted privileges to open and/or edit
- Analysis Pipelines - Lists all the analysis pipelines that have been uploaded to the Hub for use in analysis jobs. Pipelines are created in arivis Vision4D and can be made available to select or all users.
- Analysis Jobs - Where users can schedule new analyses or monitor the progress of previously scheduled jobs.
- Workflows - Where users can combine multiple analysis jobs to perform more complex analyses if needed.
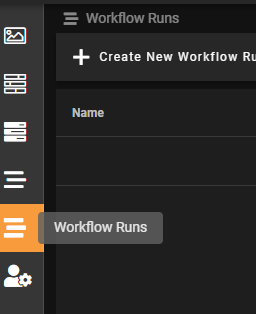
- Workflow Runs - similar to the analysis Jobs page, users can use it to schedule running workflows and monitor the progress of existing runs.
- User and Admin Groups - This page is only visible to users with admin privileges and gives access to the tools to create and manage users and groups.
Note that all these options are also accessible from any page by clicking on their corresponding thumbnails on the left.
Accessing and adding datasets
Datasets can be uploaded to the hub by any user with the right to upload datasets. From then on, these datasets will be available to this user and any other user they choose to grant the rights to view or edit the sets.
To open a folder or dataset, double-click on it. To add a dataset, click the “Add” button on the upper-left of the user interface (UI) and select "Upload dataset".
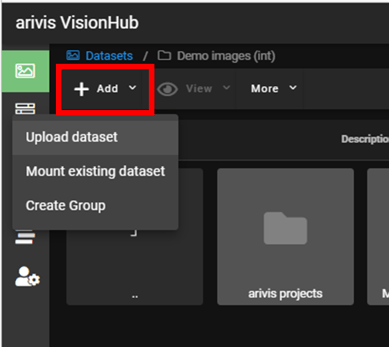
You can either Drop files directly from the windows file system or click Add Files or Add Folders on the upper left. You can give the dataset a new name or simply derive the name from the original filename. Select a destination folder and then click "Start Upload". Once a dataset has been uploaded, you can right-click on it for options such as Move and Delete.
Viewer
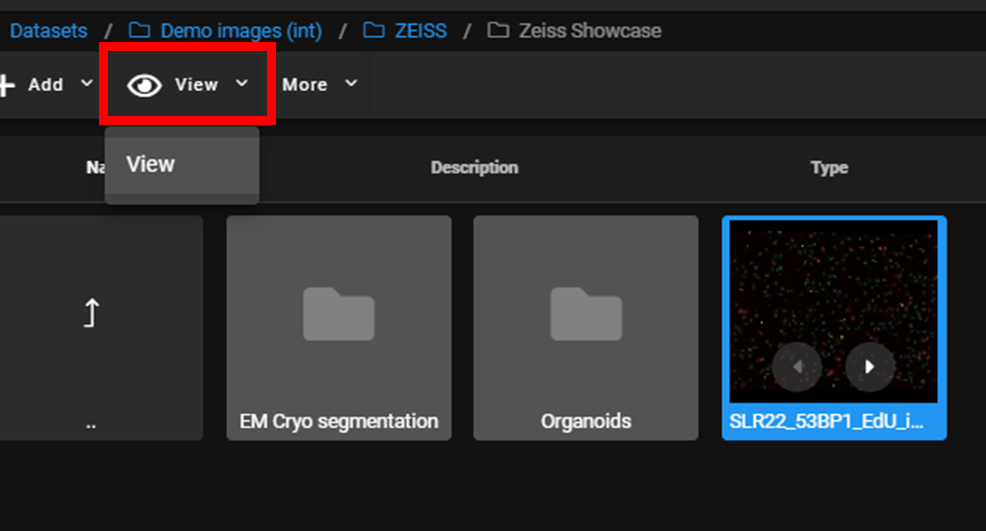
To open a dataset in the viewer you can either double-click on it or select it and click View.
Once in the Viewer, you can navigate to the dataset by using the usual mouse controls of click and drag. Use the mouse scroll-wheel to zoom in and out.
Click on the panels in the upper-left of the viewer screen.
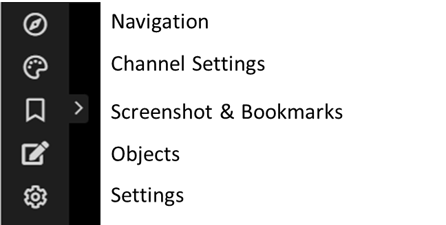
The Navigation panel is split into Gallery, Navigator, Dimensions and Player. The Gallery allows the user to select an imageset contained in the dataset. In the Navigator panel you can Fit the image so that all of the image appears in the view. 1:1 will zoom so that one pixel in the image is represented as one pixel on the screen. Use the slider to change the zoom level.
Use the Channel Settings Tab to turn channels off/on, adjust the gamma and bit depth.
The Screenshot and Bookmarks. Click 'Download screenshot' will take a screenshot and download it to your computer. Save a location and orientation on the dataset by clicking 'Add Bookmark'. Select the thumbnail for the bookmark to return to that location at any time.
The Objects tab allows for the creation of objects on the image. Objects can be manually drawn by the user or they may be created automatically as a result of running an analysis pipeline on a dataset.
To manually draw an object, select from any of the drawing tools (rectangle, polygon, measure line, brush), draw you object and press Enter to save it. It is also possible to use the brush tool. By default, any shapes will be auto-filled but this can also be turned off by unticking the auto-fill box. You can use the eraser to erase parts of the brush created object.
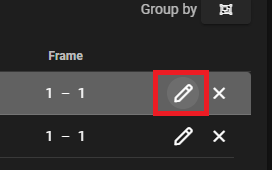
Objects can be sorted into groups. To add a group, click the "+" icon
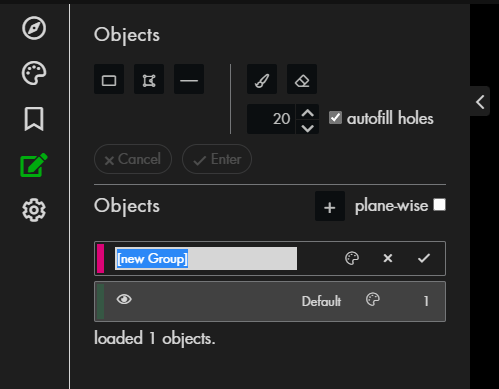
Note, if you plan on grouping objects, you should create your object group first, select it and then draw your objects. You will not be able to add objects already drawn into another group.
The Settings panel simply allows for the changing of the pixel size and background colour.
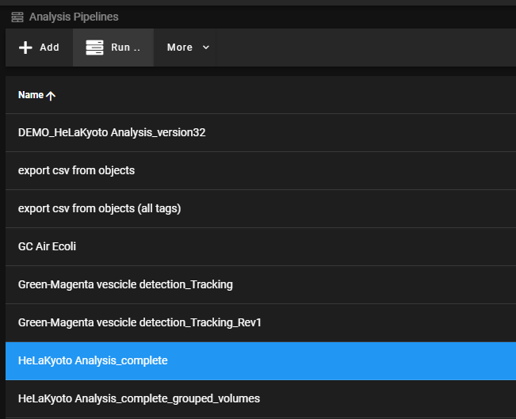
Analysis Pipelines
On this screen it is possible to upload a pipeline that has been created in Vision4D. To add a pipeline, click 'Add' in the upper left. Click on the "pipeline file" field to navigate to and select the required pipeline.
Once you have uploaded a pipeline you can then use it to analyse images. Select the pipeline and click 'Run' on the top.
Now click the blue "+" icon to add datasets to be analysed and click "Next" on the bottom right of the screen.
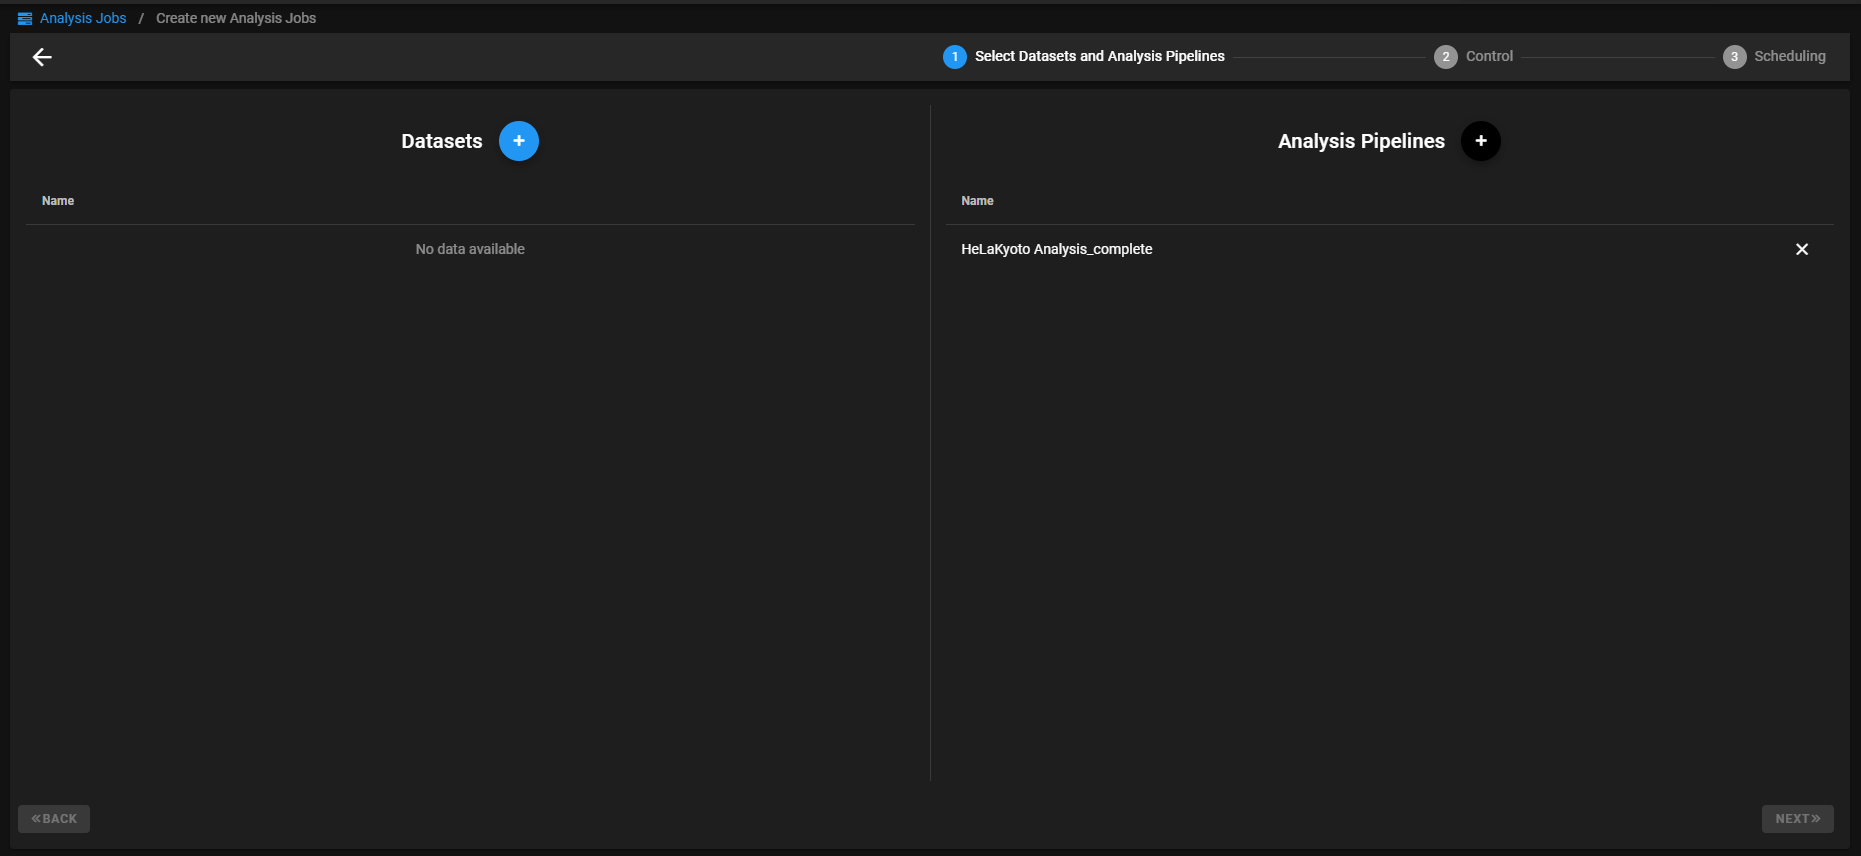
On the Control screen you can make some final definitions on what you want to analyse i.e. the X, Y and plane ranges to be analysed. To edit, click the edit icon on the right.
Once satisfied with the parameters you can click Schedule Analysis Jobs 
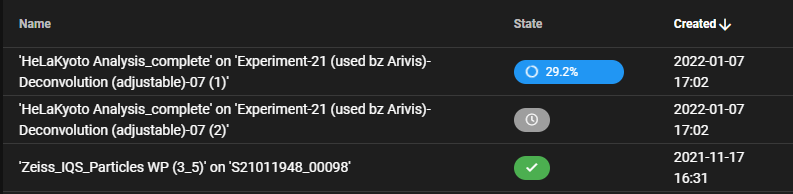
The jobs will be sent to the queue for analysis. You will now be taken automatically to the Analysis Jobs panel. You can access this any time by clicking it on the righthand side.
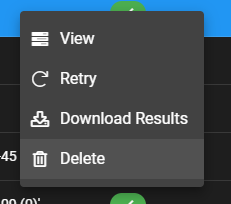
You can right-click on an analysis jobs to see options
Workflows
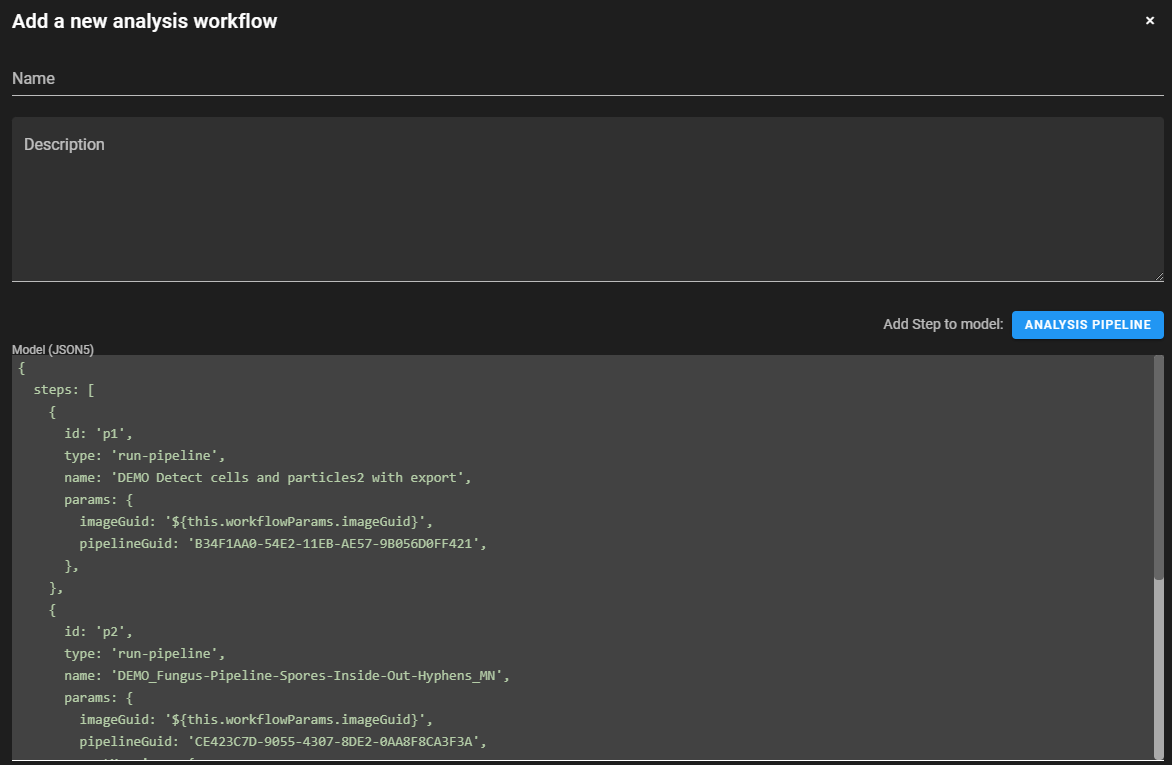
The workflows allows you to run more than one pipeline and/or scripts in succession on a dataset. For example, you could select a pipeline and then run a script on the results, followed by another pipeline. Like the pipelines tab, you simply select the pipeline or script from your file system by clicking "Add" and they will be added to the workflow.
You can create and check workflow runs from the Workflow Runs tab