This article goes through the basics of segmenting objects in Vision4D.
TLDR
Segmentation in Vision4D is done through the Analysis panel. In the analysis panel, we can build pipelines by adding operations that create objects and assign them tags that we can use in downstream pipeline operations to further refine the analysis.
The analysis panel
For those interested in the basics of what segmentation does, please consult this article in our Imaging 101 section.
In Vision4D we use the Analysis panel to create pipelines to segment and then modify objects as needed.
The analysis panel can be found under the Analysis menu if it is included in your license:
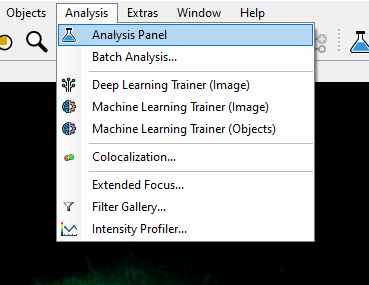
Or just click the conical flask icon in the shortcut toolbar  and the analysis panel will open on the left of the arivis window.
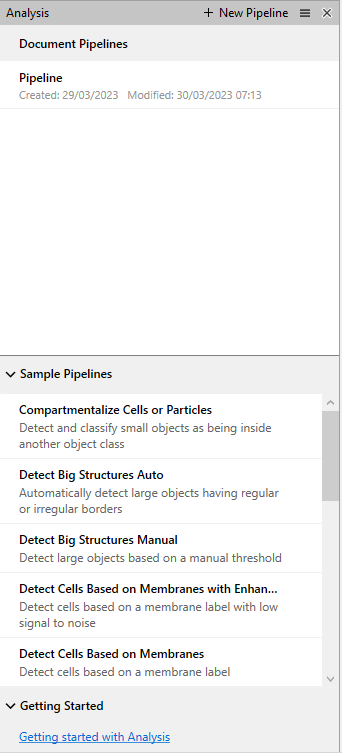
In the analysis panel, we can see and load existing document pipelines, load sample pipelines that can be adapted to our own images or used for training, and access the analysis user guide which goes into a lot more detail than this article does.
But to best explain the process, we can start with creating a new pipeline.
With the pipeline created, we can start building our analysis.
The first operation in a pipeline is always the Input ROI. Here, we define the region of the image that the pipeline will use. The idea is that if we are processing a very large dataset we can quickly build and test the pipeline using a small representative region and later run the pipeline on the full image when user input is no longer required. This can save significant time and effort. There are several options available, the details of which can be found in the help files.
For small data datasets we can select the Current Dataset option from the start. For larger datasets, especially those that include a large number of time points a Custom selection may be preferable to start with.
And then we can build our pipeline.
For now, here is the simplest segmentation pipeline we can build:
The steps of the pipeline are as follows:
- Click Add Operation + to see the list of available operations
- Select the operation you want to use (in this case an intensity threshold segmenter) and drag-&-drop it into the pipeline
- Select which channel this operation should use
- Select an intensity threshold (in this case we used the color picker, but we can also use the slider or manually type the desired value)
- Rename the output to something more relevant
- Select the pipeline outputs we want to save with the image
Some additional notes on these points:
- Most segmentation operations only work with one channel at a time (notable exceptions include region growing, machine learning, and deep learning)
- Most segmentation operations have more than one parameter to attune for a successful segmentation of your images. The help is available by pressing the F1 key and goes into detail about all these parameters
- The default output name, or tag, is the operation name, but this can cause confusion when using multiple similar segmenters on various channels to segment different objects. Choose a tag that makes sense to you as a user, especially if you plan to share this pipeline with colleagues.
- Segmentation operations rarely produce perfectly specific objects. The result of the segmentation can be refined by using other operations that call earlier pipeline objects to filter them or modify them as needed. It's best not to use tags that are too specific at this point. For example, in our example above we renamed the operation "Nuclear Segmenter" rather than "Nucleus", because we may need to filter out small objects later to specifically mark only those that are nuclei.
- Because we may need to filter out the segmentation results to identify the objects that interest us, we may end up with a pipeline with lots of objects, only a subset of which is of interest. There is usually no need to store in the image the objects we rejected in the pipeline. The Store Objects operation is added automatically to the pipeline as soon as we add any segmentation operation and allows us to select which objects we should keep. Note that by default no object tags are selected and nothing is automatically saved.
Once our pipeline is ready we can execute it to segment the objects and finally store them. To do this we can use the buttons at the top of the analysis panel:

The Play button (blue triangle) executes the complete pipeline to completion.
The right arrow executes the next operation in the pipeline.
Usually, we might run operations one at a time while building the pipeline so that we can quickly identify and correct parameters to improve the results. When the pipeline is complete we can execute the entire pipeline to completion and the software will execute all operations, including the object storage to save the objects in the image. We can then use the Objects Table to inspect and export the results.
What next?
A simple pipeline like the one above is unlikely to be the whole of the image analysis. We can also:
- use different segmentation tools to get better segmentation
- use the objects table to extract numbers from your segmentation
- and use downstream pipeline operations to filter segmentation results, use segments as seeds for creating other objects using region growing and other operations, and establish inter-object relationships like distances and parent-child grouping.